My Python Development on Cursor post got a great reception, so I thought I’d share one more bonus tip.
In this post, I’ll show you how to set up debugging for a Python project in Cursor (or any other VS Code-based code editor, such as Windsurf — formerly Codeium). I’ve also included a 🌶️ pro tip at the end, so be sure to check it out!
Install the Extension
For a smooth Python debugging experience, install the Python Debugger (ms-python.debugpy) VS Code extension. If you already installed the Python extension (ms-python.python) from my previous post, chances are the debugger is already included. 🙂
Create launch.json
You can either manually create a .vscode/launch.json file in your project or follow these steps to generate one:
-
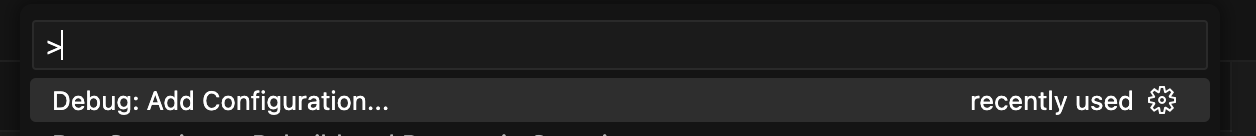
Open the Command Palette (
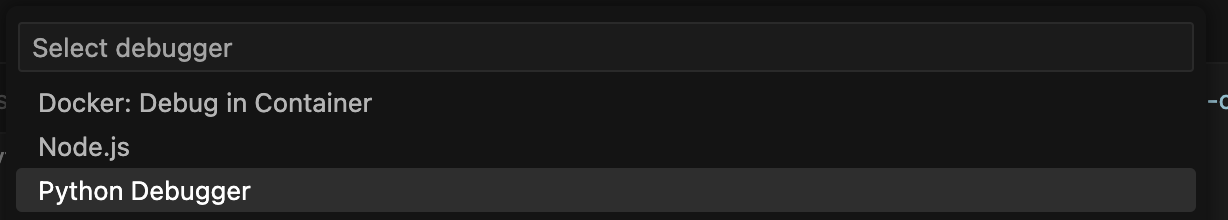
Ctrl+Shift+P), search for> Debug: Add Configuration..., and selectPython Debugger.Run ‘> Debug: Add Configuration…’
 Select ‘Python Debugger’
-
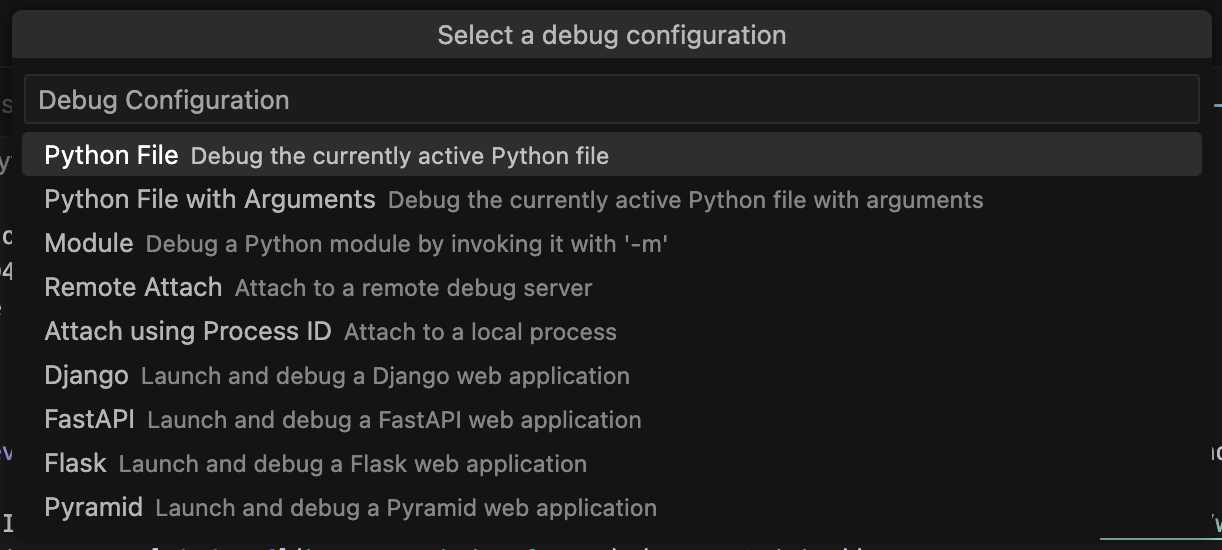
You’ll see several options — choose
Python File. This creates the.vscode/launch.jsonfile in your project directory with the following content:Select ‘Python File’
{
    // Use IntelliSense to learn about possible attributes.
    // Hover to view descriptions of existing attributes.
    // For more information, visit: https://go.microsoft.com/fwlink/?linkid=830387
    "version": "0.2.0",
    "configurations": [
        {
            "name": "Python Debugger: Current File",
            "type": "debugpy",
            "request": "launch",
            "program": "${file}",
            "console": "integratedTerminal"
        }
    ]
}
This default setup works fine, but I prefer to customize the
nameandprogramfields like this:{ //... "name": "Debug main.py", // Name of the debug configuration "program": "main.py", // Program entry point //... }Setting
"program"to a specific file (likemain.py) ensures you always launch the same entry point, even when editing other files.
Set a Breakpoint
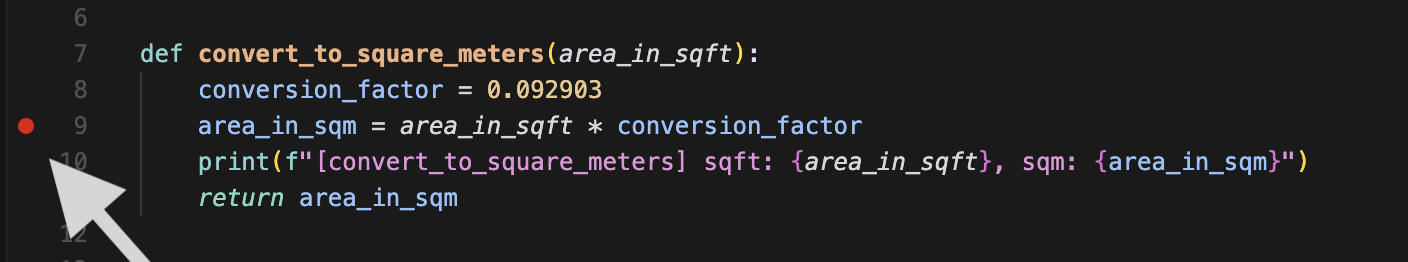
Set a breakpoint before starting the debugger — without it, the debugger won’t stop or pause execution.
If you’re new to debugging: setting a breakpoint is as simple as clicking to the left of the line number. A red dot should appear, indicating the breakpoint is active. 🙂
hover next to line number and click
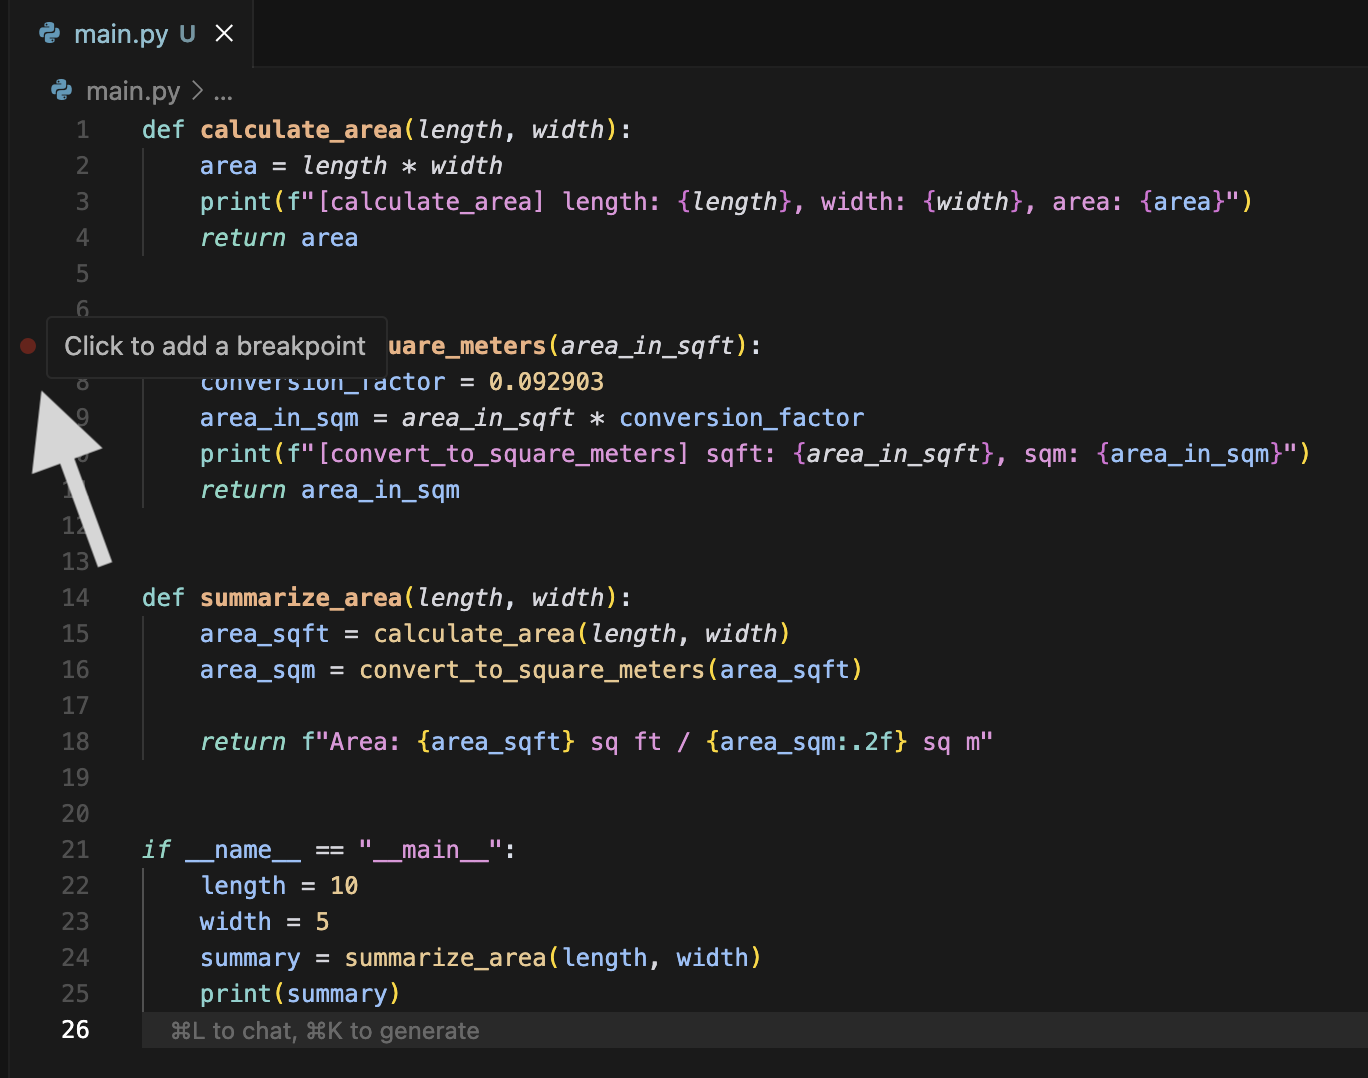
solid red dot = breakpoint added
Start the debugger
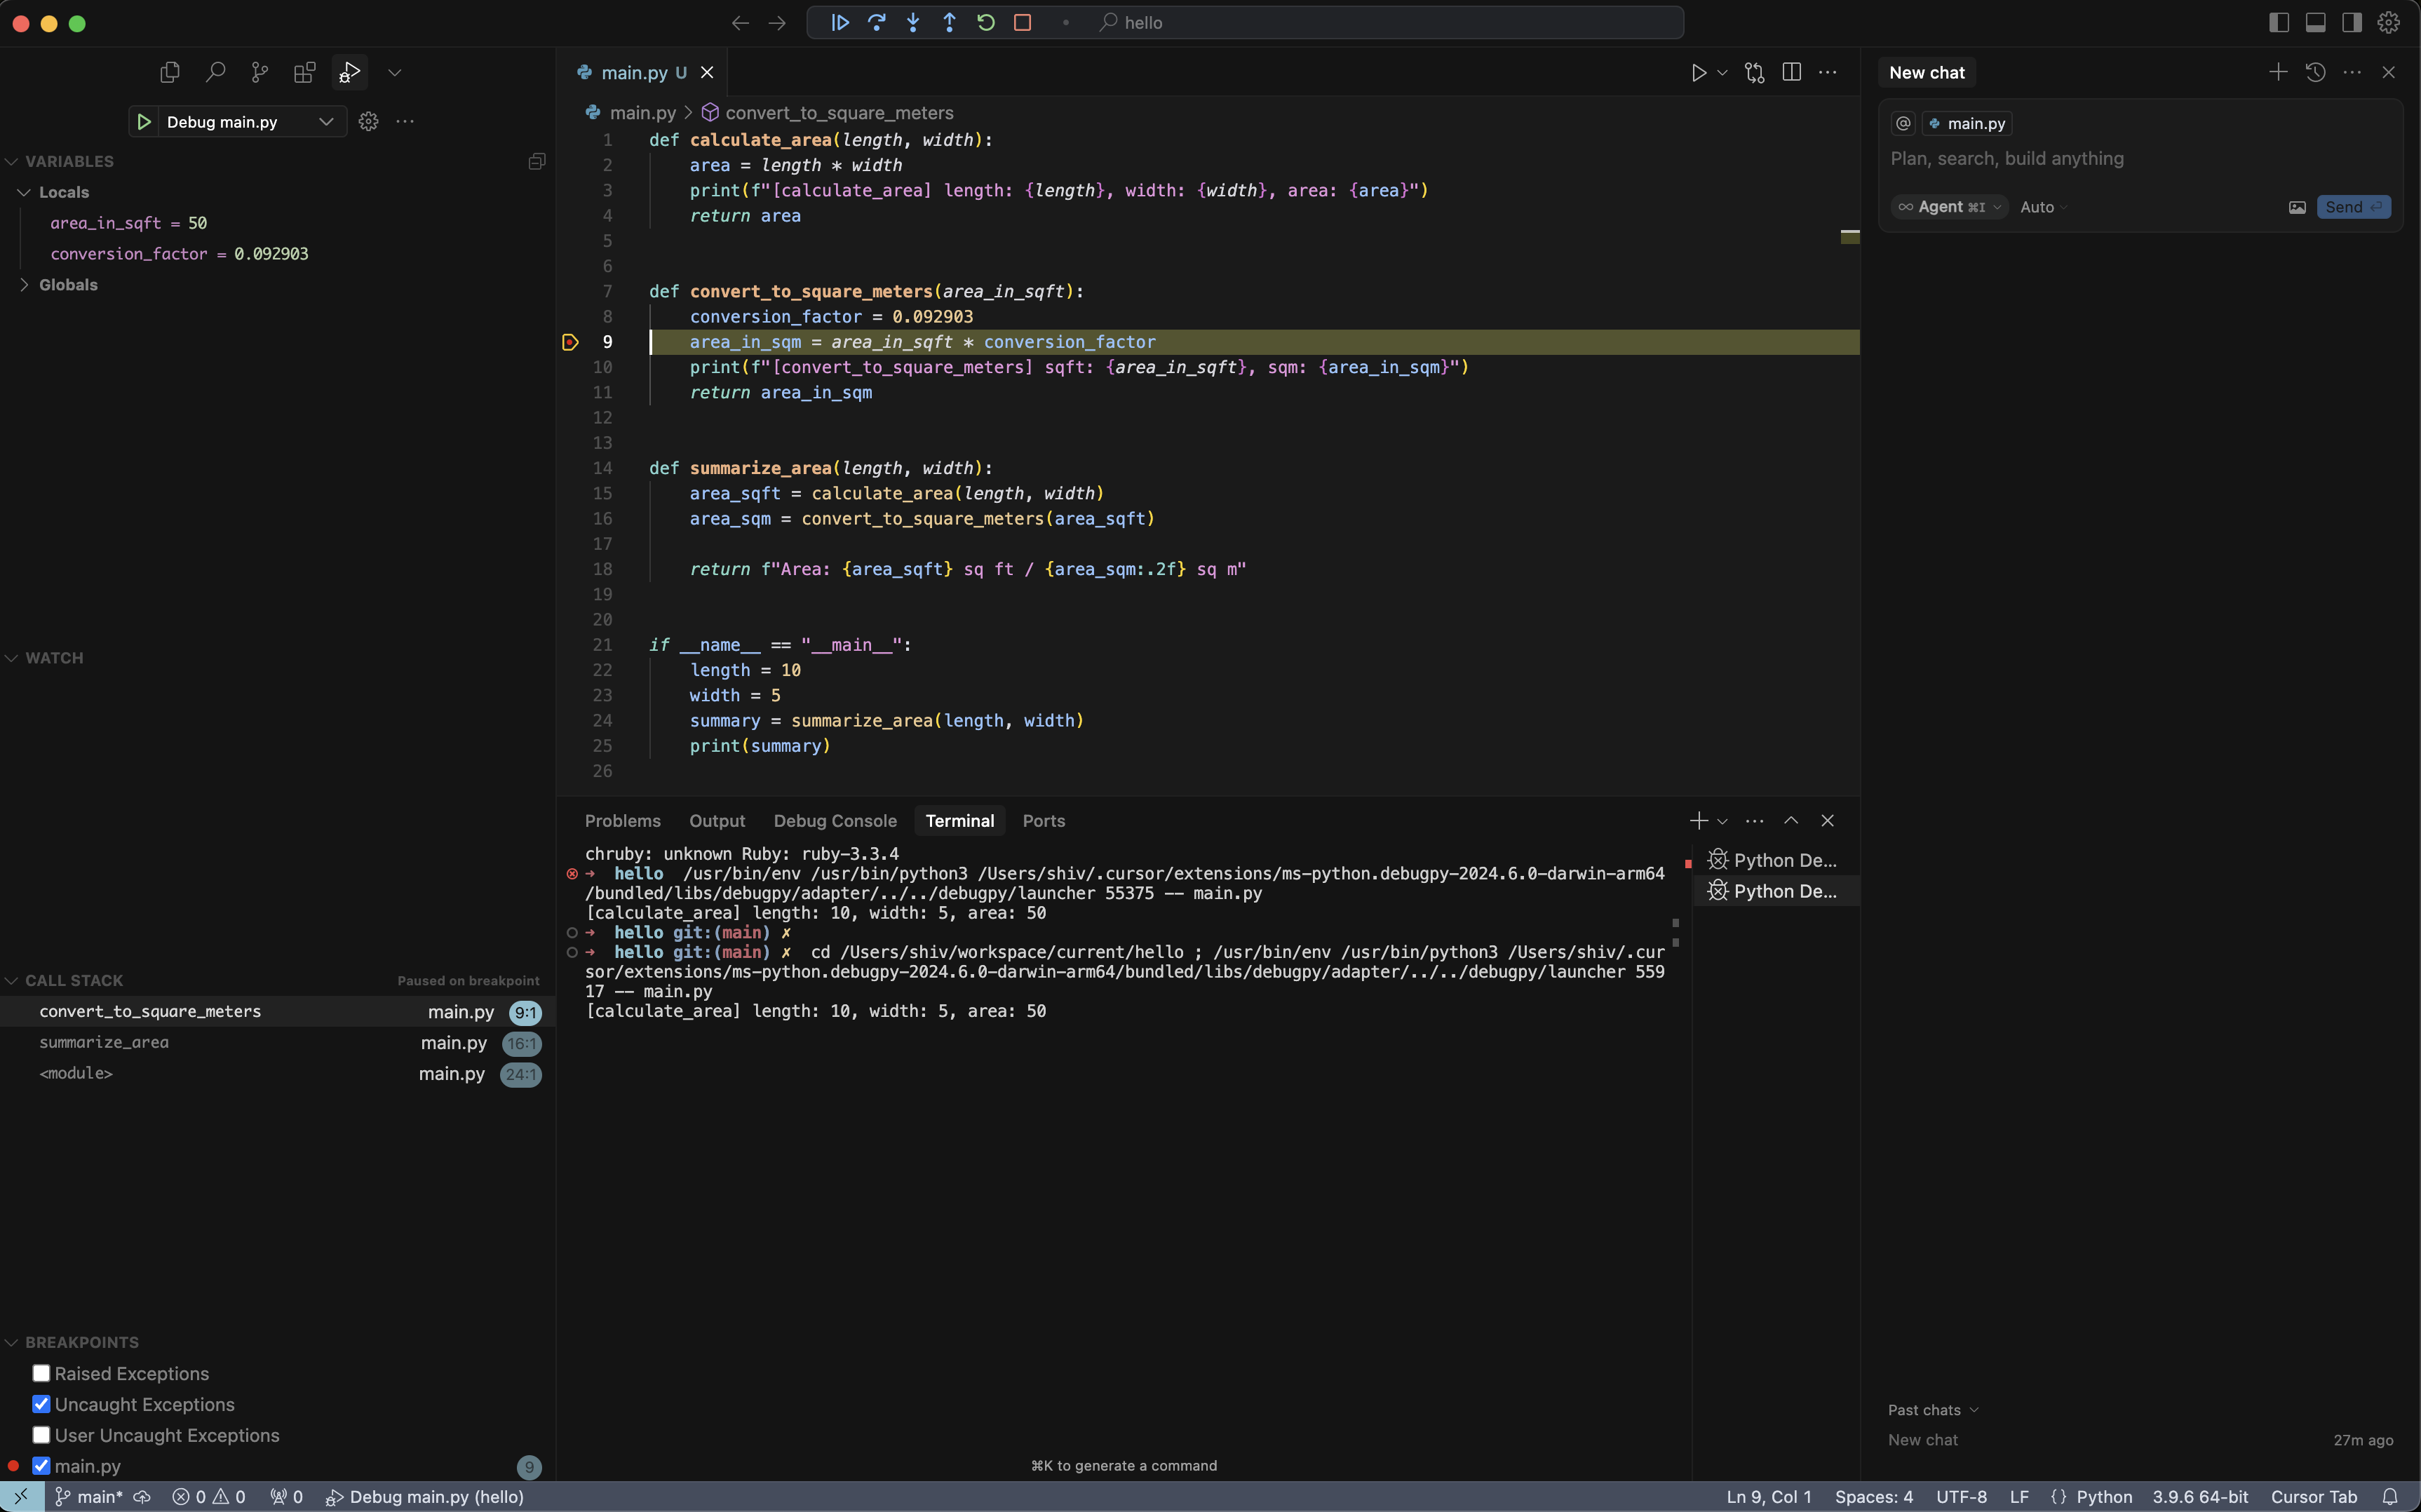
Since "request" is set to "launch" in launch.json, starting the debugger will run the program — so avoid launching it separately.
Open Command Palette (Ctrl+Shift+P) and run > View: Show Run and Debug and this opens the Run and Debug panel on the left.
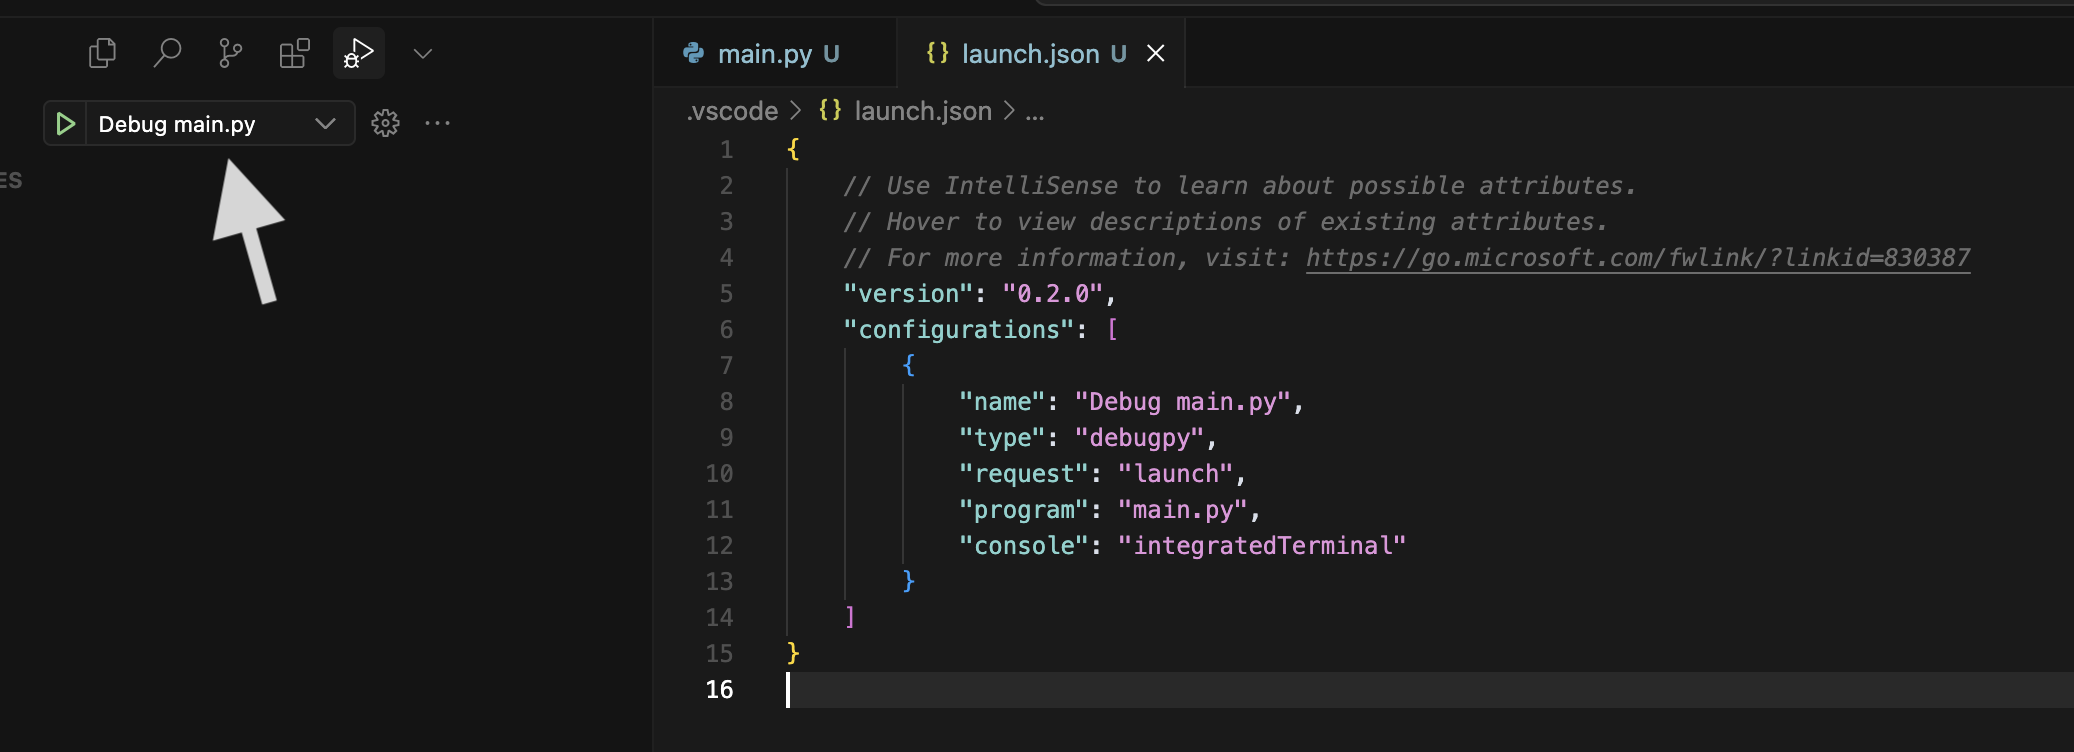
Select the debug configuration (e.g., Debug main.py) and hit ▶️ to start debugging.
I won’t go into detail on how to use the debugger here — VS Code already has a great guide with a video walkthrough.
🌶️ Pro Tip: Add Debug Bar to Command Center (Optional)
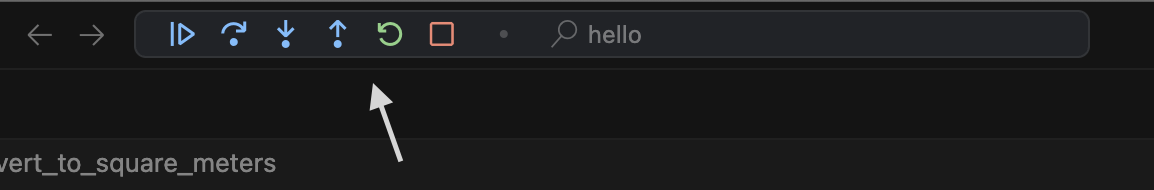
To move the floating Debug Bar to the top-center Command Center (where your project name is shown), add this setting to your User Settings (JSON):
{
  //...
  "debug.toolBarLocation": "commandCenter"
  //...
}
Need help editing your settings? Here’s how to do it.
Let me know if you’d like to see more workflow tips like this — happy to share what’s working for me!